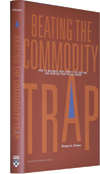
 strategy + business (Hurst) - In Beating the Commodity Trap, Richard D’Aveni, professor of strategic management at Dartmouth’s Tuck School of Business, presents the results of research into how to escape from commodity traps, the undifferentiated doom toward which competition relentlessly sweeps all products and services. The author’s classification of the dynamics that lead to commodity traps is a novel and helpful way of looking at a perennial threat to the sustainability of all organizations.
D’Aveni’s chief tool for identifying commodity traps is the price/benefit trade-off graph, which he uses to map the competitive product offerings in specific markets. Typically, the resulting plot creates a line, on which products with low prices and minimal benefits are at the bottom left corner of the graph and those with higher prices and more benefits ascend toward the upper right corner. Over time, firms can reposition their products along this line, but actions of their competitors can change the slopes of the lines themselves, disrupting incumbents and tipping them into a commodity trap. When the line flattens (so that novel features no longer command premium prices), an organization on the right-hand side of the graph is in real trouble. Worse still, economic downturns can accelerate these changes and make the resulting traps much more difficult to escape.


No comments:
Post a Comment